Tools
There are a range of quality improvement tools which will help with your project.
The tools are tried and tested and different tools will help you at different stages of your project.
They will help you to:
- Identify what your quality improvement issue is
- Understand the problem
- Develop a clear strategy
- Test your idea
- Implement your idea
- Maintain the momentum
- Measure the difference your project improvement project has made.
QI toolkit

Some of the main QI tools are here in our QI digital toolkit booklet. Please take a look (use the arrows at the bottom to turn the pages). We also have our QI bitesize animations on this page to help you. In addition there is our tools library below.
Bitesize QI
Watch our short animations to get a quick understanding of some of our tools (more coming soon).


Tool library
Our tool library contains videos, downloadable templates and a short description of some of the quality improvement tools.
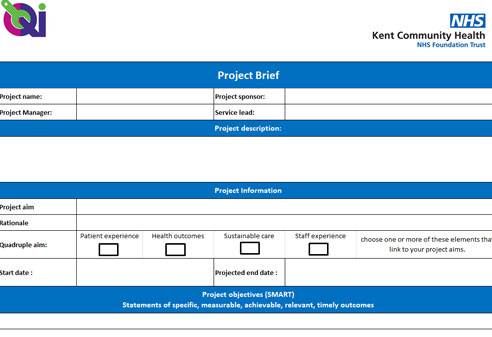
A3 project summary

Start filling this in when you first begin your quality improvement project.
Brainstorming
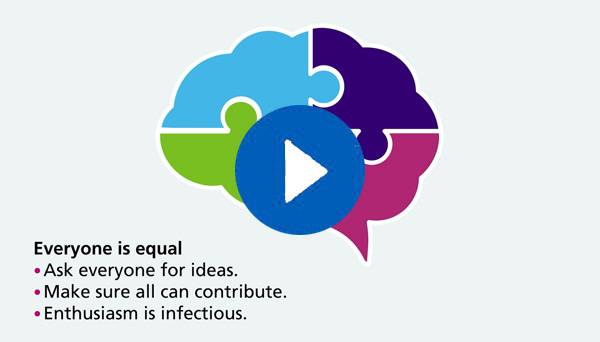
To generate lots of new ideas try a brainstorming session. This is a group creative technique to gather a list of ideas.
Developing a business case template
Use this template if you are planning to make a business case, for an innovation. Download our business case template
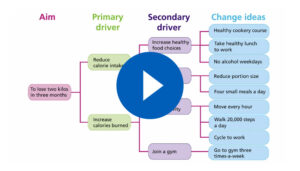
Driver diagrams

This is a tool which can help you plan your quality improvement project activities.
Fishbone diagrams
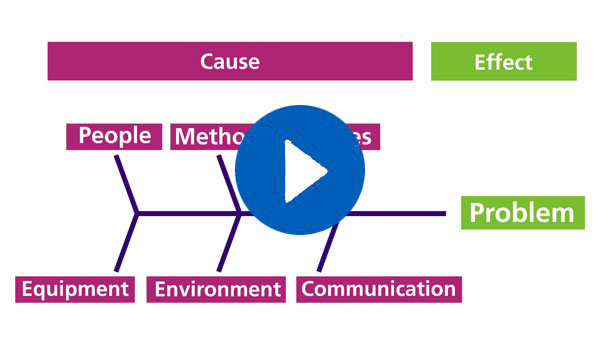
A fishbone diagram, also called a cause and effect diagram, or an Ishikawa diagram, is a visualization tool for categorizing the potential causes of a problem, in order to identify its root causes. The design of the diagram looks like a skeleton of a fish, hence the name.
Getting started

Please watch our short animation which will help you get started with your QI project.
Illustrated introduction to QI

Here is our illustrated introduction to quality improvement (QI) The drawings were created as part of our first QI conference, held in July 2019. The booklet explains some of the concepts of improvement work.
Logic model
Logic models are structured graphics to capture the theory of how a project will produce its outcomes and benefits. They reflect the relationship between input needed, activity undertaken, outputs delivered and the resulting outcomes. They are a key part of the evaluation process. Logic models should be produced through co-design. Download our template
Model for Improvement
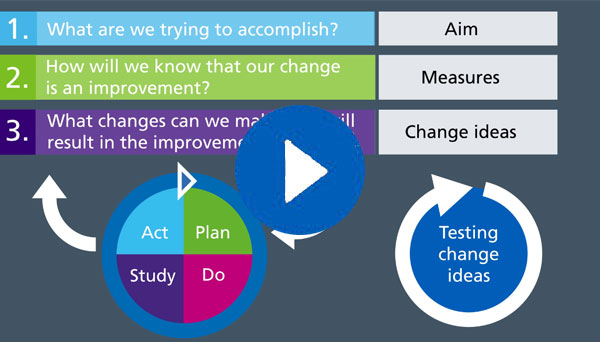
Watch our short animation to find out what the Model for Improvement is and how it can help you with your project.
Plan your project
Use our project plan templates for your project. There is a full version and a short version.
Plan, Do, Study, Act (PDSA) cycles
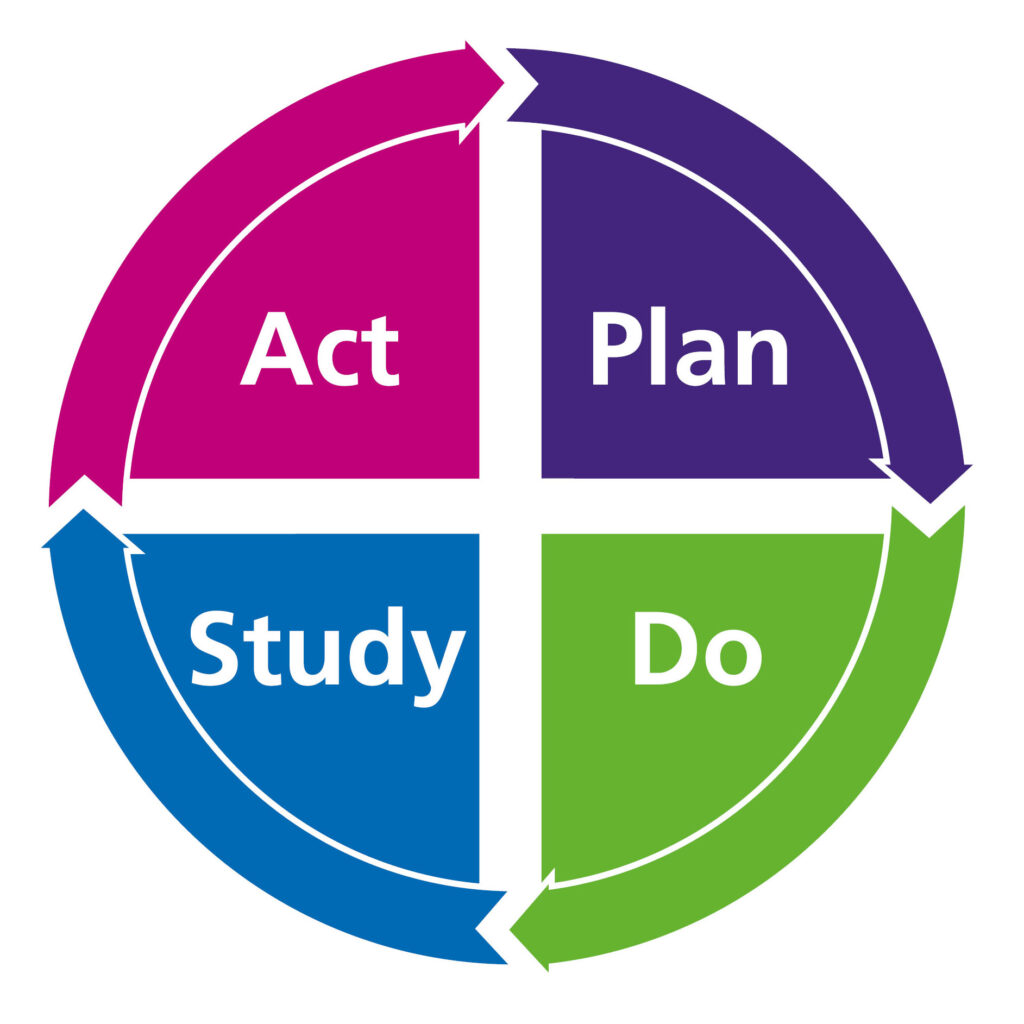
You can use PDSA cycles to test an idea, by trialling a change on a small scale and assessing its impact.
Portal diagrams
A portal diagram can help you visualise room for improvement in your process. Download a portal diagram template here to help with your QI project.
Prioritisation matrix

Use this prioritisation matrix template to help with your quality improvement project.
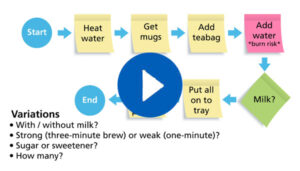
Process mapping

Process mapping allows you to create a visual picture of how something currently works, capturing every step.
Project idea brief
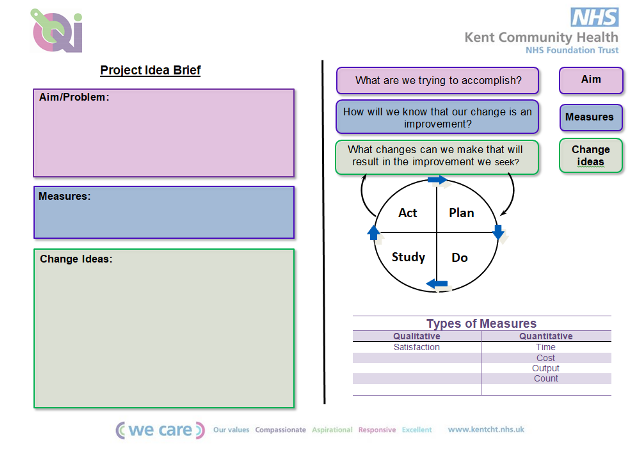
A project idea template to help you when you start a quality improvement project.
Purpose Audience Message (PAM) template
This template will help you when you are trying to define your purpose, audience and message. Download our template
QI toolkit

Find some of the main QI tools in our digital toolkit booklet. Use the arrows at the bottom to turn the pages.
Run charts
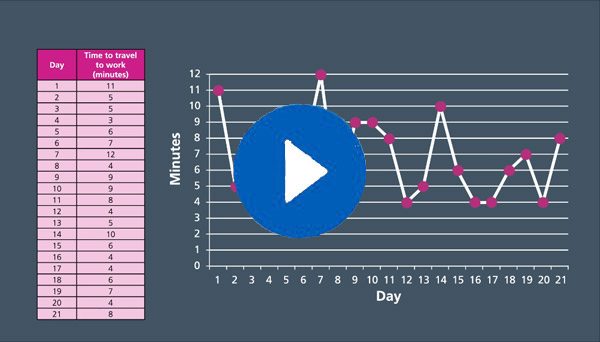
Run chart is a line graph of data plotted over time. It will help you find trends and patterns. It is a simple way to help analyse information.

SMART aims

SMART stands for specific, measurable, achievable, relevant and time bound – and SMART aims can be used to provide a structured approach to developing and designing a work plan.
Spread and adoption template
This template will help you to summarise the main spread and adoption principles for your innovation project. When reviewing innovations to see if they are applicable in your area, you may want to use the following table to consider feasibility of spread and adoption of the innovation. Download our template
Stakeholders

Involving stakeholders in your project means speaking with all those whose interests should be taken into account.
Statistical Process Control (SPC) charts
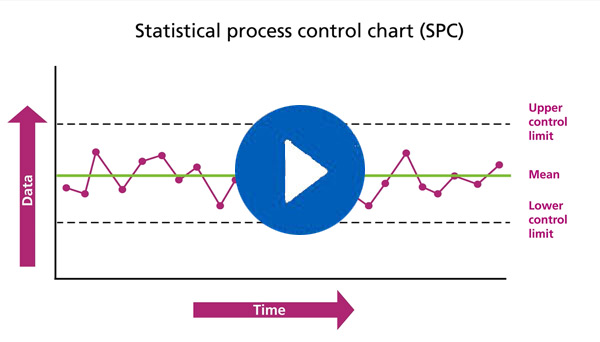
A Statistical Process Control (SPC) chart helps to see what is different to the norm. It charts changes over time and shows data plotted in time order.
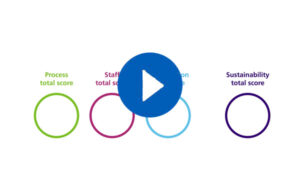
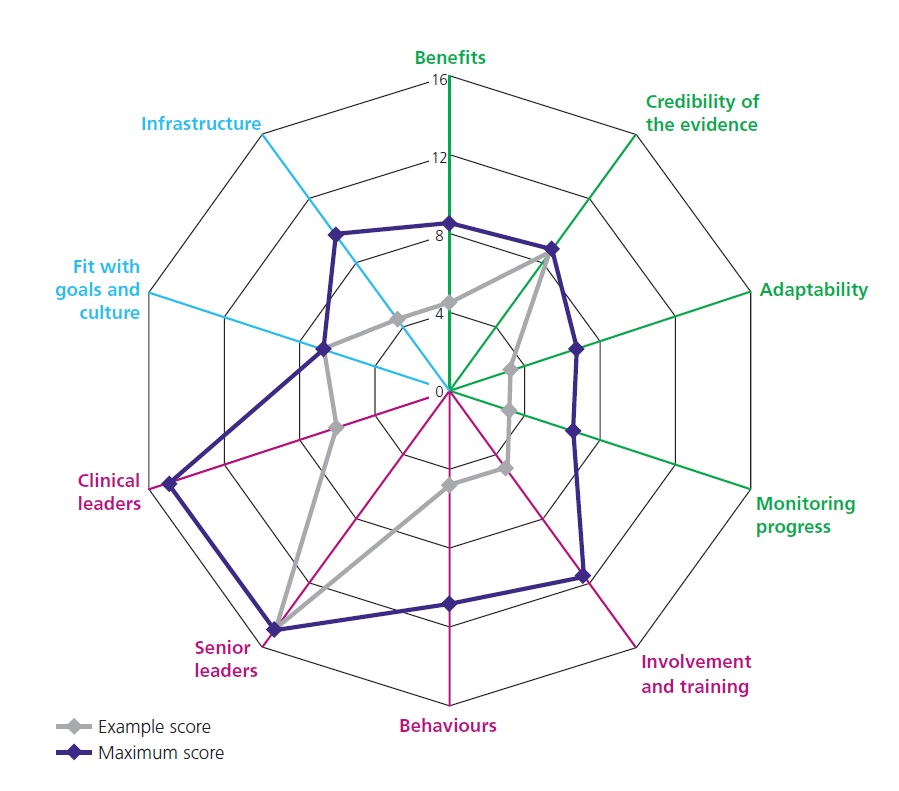
Sustainability model

This diagnostic tool helps to identify strengths and weaknesses in implementation plans.
Value proposition
A value proposition communicates the product or service benefit that you will deliver through your product or project.