Sketchnoting
Watch our series of clips to discover how to do sketchnoting.

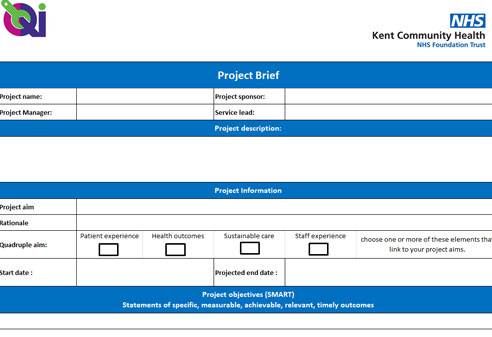
Please watch our short animation which will help you get started with your QI project. Play Video

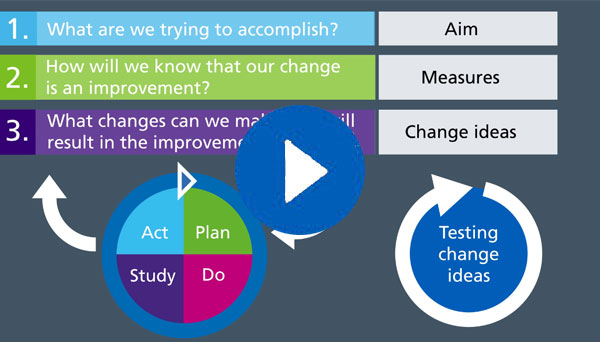
Watch our short animation to find out what the Model for Improvement is and how it can help you with your project. Play Video
Model for Improvement Read more »
Find some of the main QI tools in our digital toolkit booklet. Use the arrows at the bottom to turn the pages.

Here is our illustrated introduction to quality improvement (QI) The drawings were created as part of our first QI conference, held in July 2019. The booklet explains some of the concepts of improvement work.
Illustrated introduction to QI Read more »

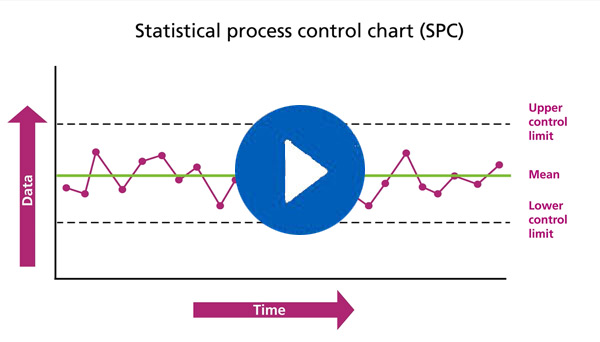
A Statistical Process Control (SPC) chart helps to see what is different to the norm. It charts changes over time and shows data plotted in time order.
Statistical Process Control (SPC) charts Read more »
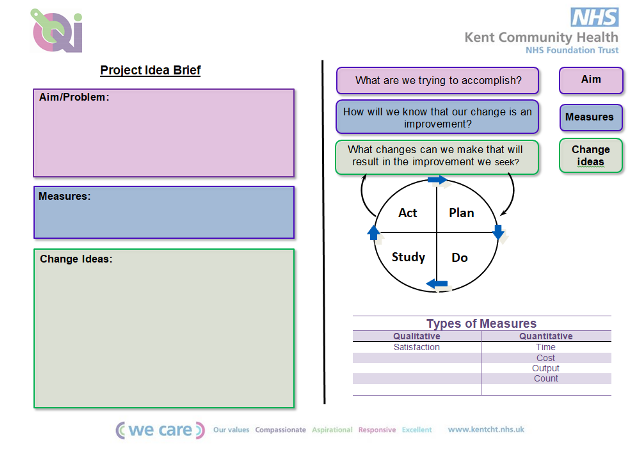
A project idea template to help you when you start a quality improvement project.
Project idea brief Read more »
This diagnostic tool helps to identify strengths and weaknesses in implementation plans.
Sustainability model Read more »

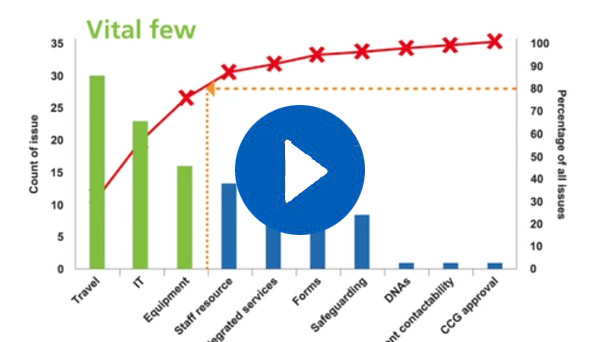
A Pareto chart is a type of chart which contains both bars and a line graph. It displays categories of data in descending order. A Pareto chart will highlight the most important among a set of factors.
Use our project plan templates for your project. There is a full version and a short version.